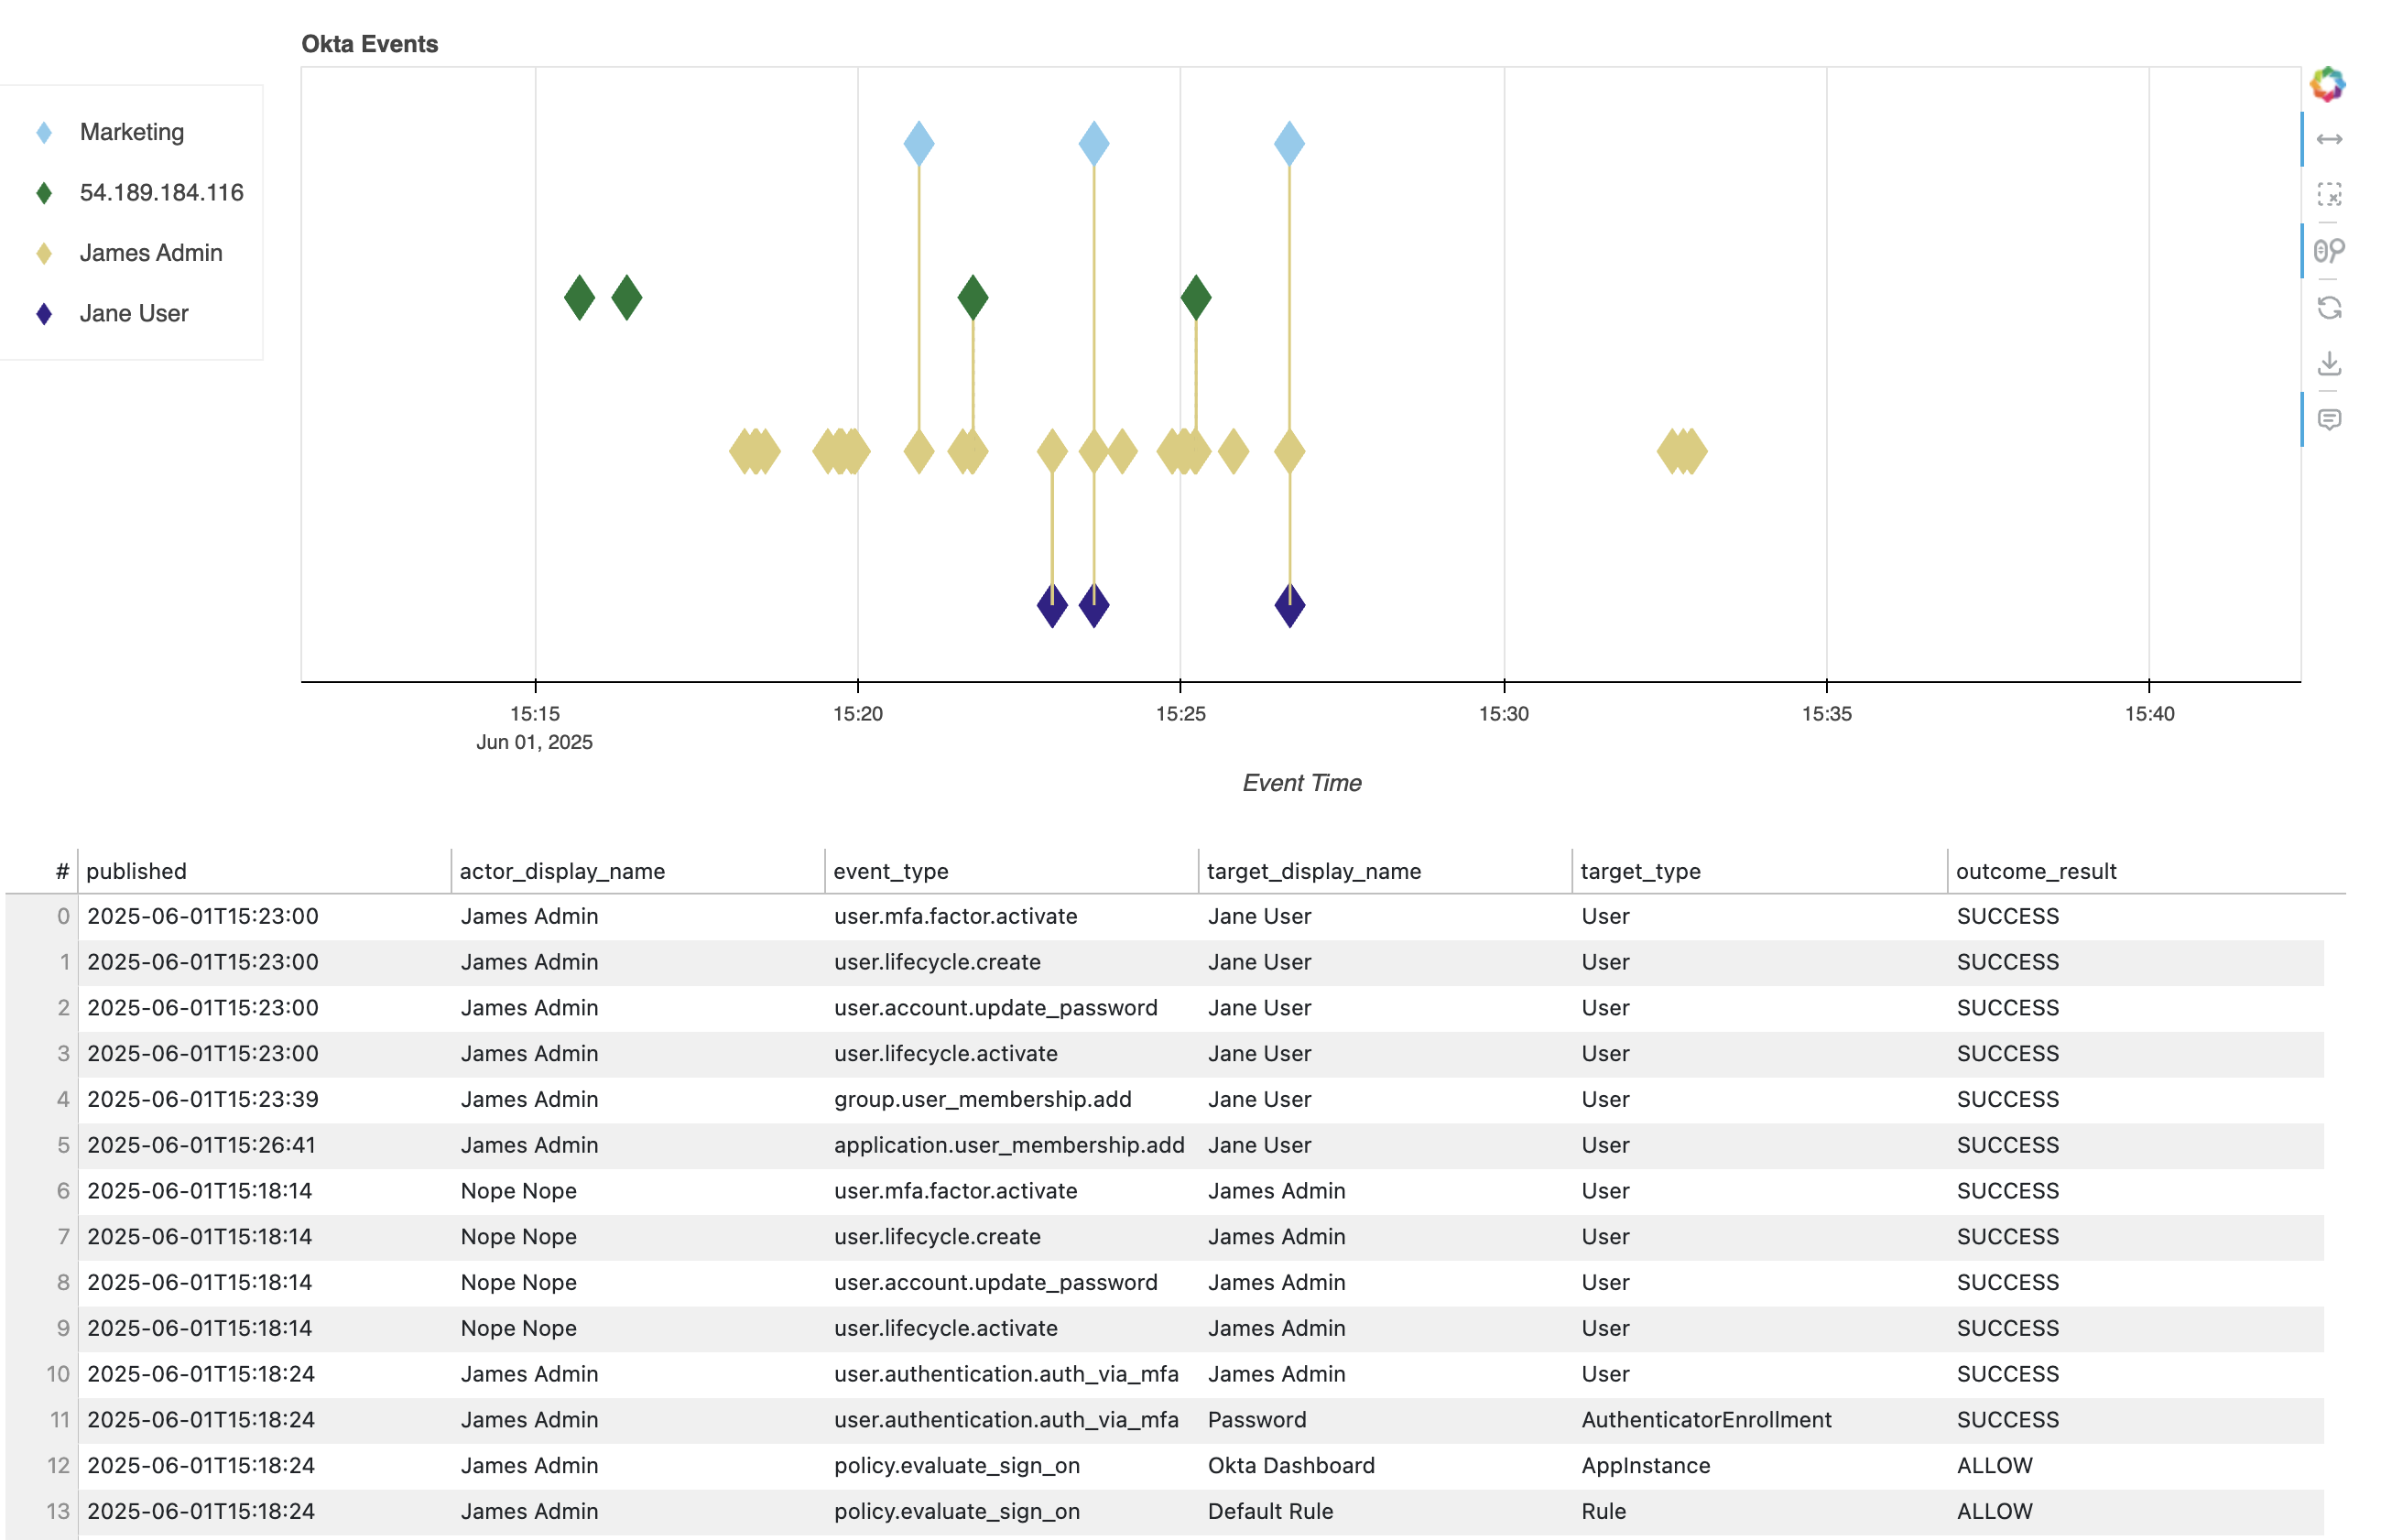
Event Timeline
Motivation
- Investigations in Okta often involve understanding how multiple objects in Okta have interacted with each other
- Okta’s logs include the concept of
actorandtarget, but visualizing complex interactions between many actors and targets is difficult with the JSON logs - This tool is intended as a useful supplement to the Okta
System Logpage, not to replace it. It’s the correlation tool that would ideally be available alongsideSystem Log— once you’ve identified correlated events, useSystem Logto pull the whole JSON for further inspection.
Basic Usage
- Choose a date range from
Events between. This field locks once you add data, so start wide and narrow down in a new search later, if you’re not exactly sure what you’re looking for - Use
Okta ID or client IPto select events from an entity. User, App, Group, Device, API Keys and Event Types all autocomplete. Session & root session IDs, any other target or actor IDs or client IP can be entered, but will not autocomplete. - Once data has been added to the tool, you’ll see events marked on a timeline & rows in a data table
- Adjust columns of interest from the
Show Columnsbox,Xthose you don’t want and add ones you do using the autocomplete. Add ID columns of interest and use them as one place to find IDs for further investigation — add all of the events from a given session ID, for example
Correlation
The Event Timeline tool correlates events when you add data from multiple entities and those event searches return the same event multiple times.
In this simplified example, a user called James Admin is initially searched for. The resulting events look something like this:
| # | searched_term | uuid | event_type | actor | target |
|---|---|---|---|---|---|
| 1 | James Admin | abcd-1234 | group.lifecyle.create | James Admin | Marketing |
| 2 | James Admin | efgh-5678 | group.user_membership.add | James Admin | Jane User |
1 is a group being created, 2 is James Admin adding Jane User to it.
Next, Jane User is searched for, the data now looks like this
| # | searched_term | uuid | event_type | actor | target |
|---|---|---|---|---|---|
| 1 | James Admin | abcd-1234 | group.lifecyle.create | James Admin | Marketing |
| 2 | James Admin | efgh-5678 | group.user_membership.add | James Admin | Jane User |
| 3 | Jane User | efgh-5678 | group.user_membership.add | James Admin | Jane User |
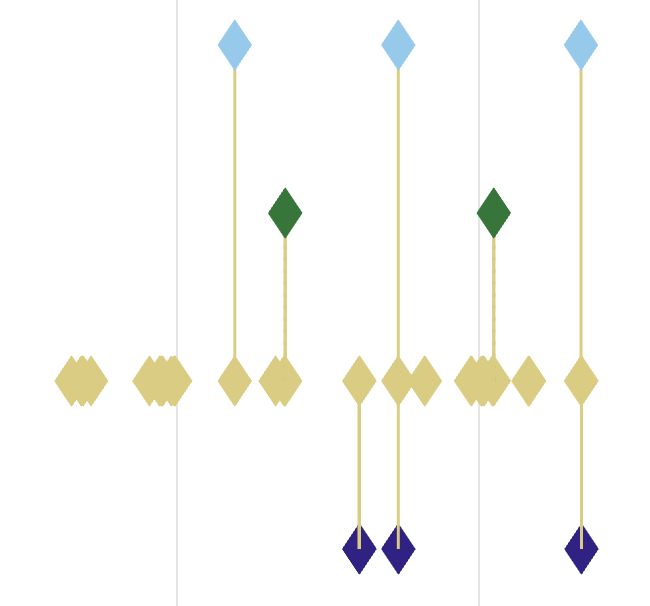
The tool can see two identical events in rows 2 and 3 but from two different search terms, James Admin and Jane User. It plots two separate series on the Event Timeline, one for the James Admin search and another for the Jane User search.
For the repeated event, it can see James Admin was the actor and Jane User was the target, so it adds a solid line using the same colour as the James Admin events and connects the diamonds representing rows 2 and 3.

As you add more data to the tool, it will continue to link diamonds with coloured lines for any repeated event. If the next search was for the Marketing group the data would contain these rows:
| # | searched_term | uuid | event_type | actor | target |
|---|---|---|---|---|---|
| 1 | James Admin | abcd-1234 | group.lifecyle.create | James Admin | Marketing |
| 2 | James Admin | efgh-5678 | group.user_membership.add | James Admin | Jane User |
| 3 | Jane User | efgh-5678 | group.user_membership.add | James Admin | Jane User |
| 4 | Marketing | efgh-5678 | group.user_membership.add | James Admin | Jane User |
| 5 | Marketing | abcd-1234 | group.lifecyle.create | James Admin | Marketing |
Now rows 2, 3 and 4 all contain the same event. The three series on the plot would all feature a diamond for this event and be linked by a solid line the same colour as the James Admin series.

Rows 1 and 5 now also contain the same event, causing the tool to link James Admin and Marketing with a separate line on the diamonds representing these rows.
As the series and correlation lines add up, you visualise all the ways entities have interacted over the given time period.
Uncertain Actor
Some events are useful for correlation, but there’s no clear Actor to link on. For instance, events where Okta issues an OAuth2 access token.
When the tool detects two events but the Actor is uncertain, it connects the diamonds with a dotted grey line.

Events from Detections
Oktually features a detections tool, if you notice an event marked with a star on the event plot it is an event which triggered a detection.
To see which detection the event triggered, add the detection_name column to the data table.
Data Table
Okta log events generally have an actor and one or more entries in a list of targets. The number of targets varies between associated event types, sometimes within a particular event type and the order isn’t always consistent either.
To be 100% accurate to the logs in Okta, each data line in the data table would map 1-1 with a published event. However, this makes representing events in a wide table cumbersome (and is likely why Okta’s System Log uses expandable rows and very few columns).
Instead, the Event Timeline tool generates a line in the data table for each log event’s target; spreading events with multiple targets over as many lines. For example, this user signing in generates three data lines for the Event Timeline tool from one event, because the event lists an AppInstance and two Rule target types.

This doesn’t usually matter for correlation purposes, it’s only once you’ve found your events of interest that reading the whole log event in it’s original form is vital (pull it from Okta’s Event Log page!). It also has the benefit of putting all of the IDs from each target into a single column, meaning the Event Timeline can easily show you events related to any current or future target.
If you truly need to differentiate specific events you can also add UUID to the visible columns, but it’s hidden by default because initial testing has showed it wasn’t required.
Event Plot
The event plot marks most events with a diamond. Events from a detection are marked with a star. Each entity you add to the plot has a different colour (up to 9 entities).
Event marks are large enough to see clearly but will overlay easily when events occurred close to one another. Hold your cursor close to an event of interest and scroll to zoom the plot; see how the event makrs separate out as you zoom in on smaller time ranges.
Controls
Activate different controls for the Event Timeline plot with the vertical list of icons to the right of the plot.
By default you:
- Scroll to zoom the timeline in/out
- Click and drag to pan along the timeline
- Hover over a diamond to see details about the event
Hover over controls to see their name, turn controls on or off by clicking them. Use Reset to reset the plot’s zoom & pan
Event Selection
The data table and event timeline share a single data source, meaning you can select data in one and the selection will also apply to the other.
Data Table
Select rows in the data table and marks in the event timeline that don’t correspond to the selected rows will become outlines.

Event Timeline
To select events from the timeline, activate the Box Select (x-axis) tool, then click and drag over the desired time period. Because you’re selecting from the timeline, it’s useful to sort the table by published